
Article
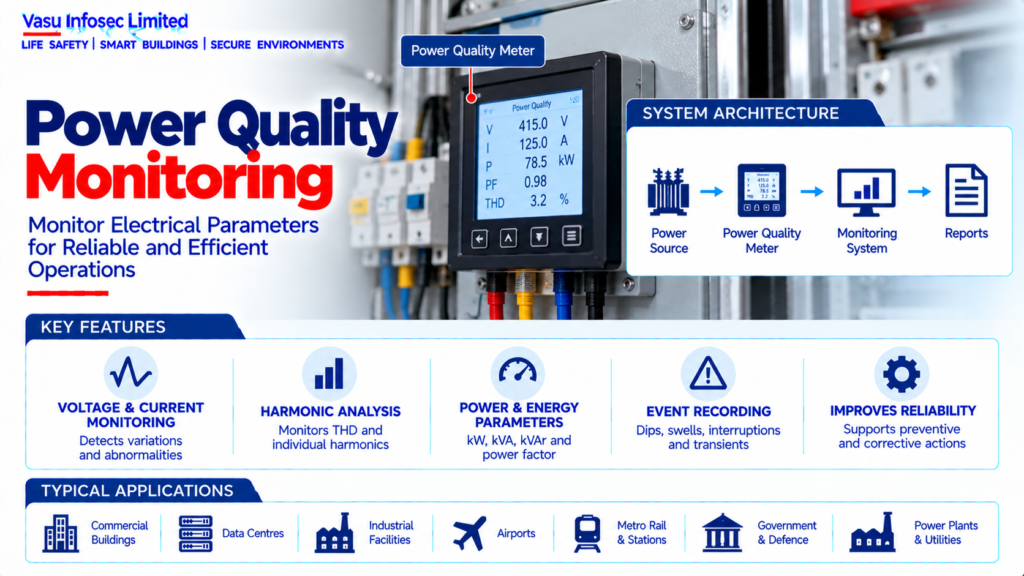
Power Quality Monitoring
Oct 2026
Direct Answer
Power quality monitoring measures and analyses electrical parameters such as voltage, current, frequency, power factor, harmonics, transients, unbalance and interruptions to identify disturbances that may affect equipment performance and continuity.
1. Engineering Overview
Power Quality Monitoring is the systematic measurement and analysis of electrical parameters to identify disturbances that may affect equipment performance, reliability, energy efficiency and operational continuity. A complete monitoring system evaluates voltage, current, frequency, power factor, harmonics, transients, unbalance, interruptions and other relevant parameters.
2. Complete Power Quality Monitoring Architecture
Utility / Transformer → Main Switchboard → Distribution → Critical / Sensitive Loads
Measurement Points → CTs / VTs / Direct Voltage Inputs → Power Quality Meter → Data Logger / Gateway → EPMS / BMS / SCADA → Dashboard / Reports
Monitoring → Voltage → Current → Frequency → kW / kVA / kVAr → PF → THD → Harmonics → Unbalance → Events / Transients
3. Monitoring Objectives
The primary objectives are to establish a baseline, identify abnormal electrical conditions, support troubleshooting, verify system performance, assess equipment impact and provide historical data for preventive and corrective actions.
4. Voltage Monitoring
Voltage should be monitored for magnitude, variation, dips, swells, interruptions and other deviations relevant to the installation. Monitoring points should be selected to represent the main supply and sensitive distribution sections.
5. Current Monitoring
Current measurements support assessment of loading, phase balance, overload conditions and abnormal operating behaviour. Current data can also assist in identifying changes in equipment utilisation.
6. Frequency Monitoring
Frequency should be monitored where supply stability is critical, particularly for generator-fed systems, isolated networks and sensitive equipment. Frequency deviations should be correlated with operating events.
7. Active, Reactive & Apparent Power
Monitoring of kW, kVAr and kVA provides visibility of real and reactive loading. These measurements support transformer, DG, UPS and power-factor assessments.
8. Power Factor Monitoring
Power factor monitoring identifies changes in reactive demand and supports evaluation of capacitor banks, APFC systems and facility loading. Leading or lagging conditions should be interpreted according to the system operating mode.
9. Harmonic Monitoring
Harmonic measurements identify distortion produced by nonlinear loads such as UPS systems, variable-frequency drives, IT equipment and power electronic converters. Total harmonic distortion and individual harmonic components may be monitored.
10. Voltage Harmonics
Voltage harmonic distortion can affect sensitive equipment and may indicate interaction between system impedance and nonlinear current sources. Measurements should be taken at appropriate electrical buses.
11. Current Harmonics
Current harmonics indicate the distortion introduced by connected nonlinear loads. High harmonic current can increase conductor, transformer and neutral heating and may influence power-quality performance.
12. Total Harmonic Distortion
THD is a measure of the harmonic content relative to the fundamental component. Monitoring should use the applicable measurement methodology and project / equipment criteria.
13. Voltage Unbalance
Voltage unbalance between phases can adversely affect three-phase motors and other equipment. Monitoring should identify persistent phase-voltage differences and abnormal operating conditions.
14. Current Unbalance
Current unbalance can indicate uneven single-phase loading, motor problems, supply conditions or other abnormalities. It should be reviewed alongside voltage and load information.
15. Voltage Dips & Swells
Short-duration voltage dips and swells can result from faults, large-load switching, motor starting or source disturbances. Event capture should record magnitude and duration where supported.
16. Interruptions
Power-quality monitoring can record supply interruptions and their duration. Correlation with AMF, DG, UPS and protection events can help establish the cause and system response.
17. Transient Monitoring
Transient monitoring identifies fast overvoltage events associated with switching or lightning-related disturbances. Suitable instruments and sampling rates are required to capture these events.
18. Flicker Monitoring
Voltage fluctuation caused by rapidly varying loads can produce visible lighting flicker and affect sensitive equipment. Where applicable, flicker should be monitored using appropriate measurement methods.
19. Measurement Instrumentation
Power-quality meters should be selected according to system voltage, current, measurement accuracy, required parameters, sampling capability, communications and installation environment.
20. CT / VT Integration
Current transformers and voltage transformers may provide measurement inputs to monitoring equipment. CT / VT ratios, accuracy, polarity and wiring should be verified to ensure reliable measurement.
21. Monitoring Locations
Monitoring points should be selected at utility incomers, transformer secondary, main switchboards, DG outputs, UPS systems and other critical distribution points as required by the approved monitoring strategy.
22. Data Acquisition
Measured values and event records may be collected locally or transmitted to a central monitoring platform. Sampling, logging interval, event recording and data retention should match the operational requirements.
23. EPMS / BMS / SCADA Integration
Power-quality data may be integrated with an Electrical Power Monitoring System, BMS or SCADA. Required measurements, alarms, events and communication protocols should be defined in the approved interface matrix.
24. Alarm Management
Alarms may be generated for high / low voltage, frequency deviation, overload, high THD, power-factor deviation, unbalance, communication failure and other configured conditions. Alarm thresholds should be based on the applicable operating criteria.
25. Trend Analysis
Historical trends help identify gradual changes in loading, harmonics, voltage stability, power factor and equipment behaviour. Trend analysis can support predictive maintenance and capacity planning.
26. Baseline Assessment
A baseline power-quality survey should be established under representative operating conditions. Subsequent measurements can then be compared against the baseline to identify deterioration or abnormal behaviour.
27. Installation Requirements
Installation should verify:
- Correct monitoring points
- Correct meter ratings
- Correct CT / VT ratios
- Correct wiring and polarity
- Correct measurement parameters
- Correct communication network
- Correct alarm thresholds
- Correct time synchronisation
- Correct data logging
- Correct EPMS / BMS / SCADA interface
- Proper identification and labelling
28. Testing & Commissioning
Power-quality monitoring commissioning should verify:
- Voltage measurements
- Current measurements
- Frequency
- kW / kVA / kVAr
- Power factor
- Harmonic measurements
- Unbalance measurements
- Event recording
- Alarm operation
- Communication
- Data logging
- Time synchronisation
- Dashboard / reporting functions
29. Maintenance
Maintenance should include inspection of meters, CT / VT connections, communication links, monitoring servers, gateways, time synchronisation and data storage. Measurement accuracy should be periodically verified according to the approved maintenance programme.
30. Failure & Recovery
The monitoring system should be assessed for meter failure, communication loss, incorrect CT polarity, data gaps, gateway failure and server / software faults. Monitoring failures should be distinguished from actual electrical disturbances.
31. Design Change Control
Changes to electrical distribution, transformers, DG sets, UPS systems, major nonlinear loads, power-factor correction or monitoring architecture should trigger a review of measurement points and alarm thresholds.
32. Documentation
Power-quality monitoring documentation should include, as applicable:
- Monitoring architecture
- Meter schedule
- Measurement-point schedule
- CT / VT details
- Communication architecture
- Parameter list
- Alarm matrix
- Data-retention requirements
- Baseline survey report
- Power-quality reports
- Testing and commissioning records
- Maintenance records
- As-built drawings
- O&M manual
33. Engineering Objective
The engineering objective is:
Identify Critical Monitoring Points → Select Appropriate Power-Quality Meters → Establish Accurate CT / VT Inputs → Measure Voltage, Current, Frequency, PF & Harmonics → Capture Events & Trends → Integrate EPMS / BMS / SCADA → Analyse Abnormal Conditions → Initiate Corrective Action → Establish Continuous Electrical Performance Visibility
Frequently Asked Questions
Which parameters may be monitored?
Voltage, current, frequency, kW, kVA, kVAr, power factor, harmonics/THD, unbalance, dips, swells, interruptions, transients and events.
Why establish a baseline?
Representative baseline measurements allow later readings to be compared for deterioration or abnormal behaviour.
Can data integrate with other platforms?
The source notes possible integration with EPMS, BMS or SCADA under an approved interface matrix.
SEO & Publishing Details
| Field | Suggested website content |
| SEO title | Power Quality Monitoring | Electrical Engineering Guide |
| Meta description | Learn about power quality monitoring, including architecture, design considerations, installation, testing, maintenance and documentation. |
| Primary keyword | power quality monitoring |
| Secondary keywords | power quality monitoring architecture, power quality monitoring design, power quality monitoring testing, electrical and power systems |
| Suggested URL slug | power-quality-monitoring |
| Suggested image alt text | Illustration of power quality monitoring architecture and main components |